워크플로우 디버깅
AI 지원 번역 - 자세히 알아보기 및 개선 제안
디버깅은 수많은 시간을 절약하고 더 효과적인 Nextflow 개발자가 될 수 있도록 도와주는 핵심 기술입니다. 특히 처음 시작할 때, 워크플로우를 구축하고 유지 관리하는 과정에서 버그를 만나게 됩니다. 체계적인 디버깅 방법을 익히면 문제를 빠르게 파악하고 해결할 수 있습니다.
학습 목표
이 사이드 퀘스트에서는 Nextflow 워크플로우를 위한 체계적인 디버깅 기법을 학습합니다:
- 구문 오류 디버깅: IDE 기능과 Nextflow 오류 메시지를 효과적으로 활용하기
- 채널 디버깅: 데이터 흐름 문제와 채널 구조 문제 진단하기
- 프로세스 디버깅: 실행 실패 및 리소스 문제 조사하기
- 내장 디버깅 도구: Nextflow의 preview 모드, stub 실행, work 디렉토리 활용하기
- 체계적인 접근법: 효율적인 디버깅을 위한 4단계 방법론
이 과정을 마치면, 당혹스러운 오류 메시지를 명확한 해결 로드맵으로 전환하는 강력한 디버깅 방법론을 갖추게 됩니다.
사전 요구 사항
이 사이드 퀘스트를 시작하기 전에 다음을 준비하세요:
- Hello Nextflow 튜토리얼 또는 동급의 입문 과정을 완료해야 합니다.
- 기본적인 Nextflow 개념과 메커니즘(프로세스, 채널, 연산자)을 편안하게 사용할 수 있어야 합니다.
선택 사항: 먼저 Nextflow 개발을 위한 IDE 기능 사이드 퀘스트를 완료하는 것을 권장합니다. 해당 과정에서는 디버깅을 지원하는 IDE 기능(구문 강조, 오류 감지 등)을 포괄적으로 다루며, 여기서도 많이 활용합니다.
0. 시작하기
교육 codespace 열기
아직 열지 않았다면, 환경 설정에 설명된 대로 교육 환경을 열어 주세요.
![]()
프로젝트 디렉토리로 이동
이 튜토리얼의 파일이 있는 디렉토리로 이동합니다.
VSCode에서 이 디렉토리에 포커스를 맞출 수 있습니다:
자료 검토
다양한 유형의 버그가 포함된 예제 워크플로우 파일들을 확인할 수 있습니다. 이 파일들을 실습에 활용합니다:
디렉토리 내용
.
├── bad_bash_var.nf
├── bad_channel_shape.nf
├── bad_channel_shape_viewed_debug.nf
├── bad_channel_shape_viewed.nf
├── bad_number_inputs.nf
├── badpractice_syntax.nf
├── bad_resources.nf
├── bad_syntax.nf
├── buggy_workflow.nf
├── data
│   ├── sample_001.fastq.gz
│   ├── sample_002.fastq.gz
│   ├── sample_003.fastq.gz
│   ├── sample_004.fastq.gz
│   ├── sample_005.fastq.gz
│   └── sample_data.csv
├── exhausted.nf
├── invalid_process.nf
├── missing_output.nf
├── missing_software.nf
├── missing_software_with_stub.nf
├── nextflow.config
└── no_such_var.nf
이 파일들은 실제 개발 환경에서 자주 마주치는 디버깅 시나리오를 나타냅니다.
과제 검토
각 워크플로우를 실행하고, 오류를 파악하고, 수정하는 것이 목표입니다.
각 버그가 있는 워크플로우에 대해:
- 워크플로우를 실행하고 오류를 확인합니다.
- 오류 메시지를 분석합니다: Nextflow가 무엇을 알려주고 있나요?
- 제공된 단서를 활용하여 코드에서 문제를 찾습니다.
- 버그를 수정하고 해결책이 작동하는지 확인합니다.
- 다음 섹션으로 넘어가기 전에 파일을 초기화합니다 (
git checkout <filename>사용).
연습 문제는 단순한 구문 오류에서 더 미묘한 런타임 문제로 점진적으로 진행됩니다. 해결책은 본문에서 설명하지만, 먼저 스스로 풀어보고 나서 읽어 보세요.
준비 확인 목록
시작할 준비가 되었나요?
- 이 과정의 목표와 사전 요구 사항을 이해했습니다.
- codespace가 실행 중입니다.
- 작업 디렉토리를 적절히 설정했습니다.
- 과제 내용을 이해했습니다.
모든 항목을 확인했다면 시작할 준비가 된 것입니다.
1. 구문 오류
구문 오류는 Nextflow 코드를 작성할 때 가장 흔히 발생하는 오류 유형입니다. 코드가 Nextflow DSL의 예상 구문 규칙을 따르지 않을 때 발생합니다. 이러한 오류는 워크플로우 실행 자체를 막기 때문에, 빠르게 파악하고 수정하는 방법을 익히는 것이 중요합니다.
1.1. 중괄호 누락
가장 흔한 구문 오류 중 하나이자, 때로는 디버깅하기 가장 복잡한 오류 중 하나가 중괄호 누락 또는 불일치입니다.
실제 예제로 시작해 보겠습니다.
파이프라인 실행
명령 출력
구문 오류 메시지의 핵심 요소:
- 파일 및 위치: 오류가 있는 파일과 줄/열을 표시합니다 (
bad_syntax.nf:24:1) - 오류 설명: 분석기가 예상하지 못한 내용을 설명합니다 (
Unexpected input: '<EOF>') - EOF 표시:
<EOF>(End Of File) 메시지는 분석기가 더 많은 내용을 기대하는 상태에서 파일 끝에 도달했음을 나타냅니다. 닫히지 않은 중괄호의 전형적인 신호입니다.
코드 확인
이제 bad_syntax.nf를 살펴보고 오류의 원인을 파악합니다:
이 예제에서는 오류 위치를 표시하는 주석을 남겨두었습니다. Nextflow VSCode 확장 프로그램도 불일치하는 중괄호를 빨간색으로 표시하고 파일의 조기 종료를 강조하여 힌트를 제공합니다:
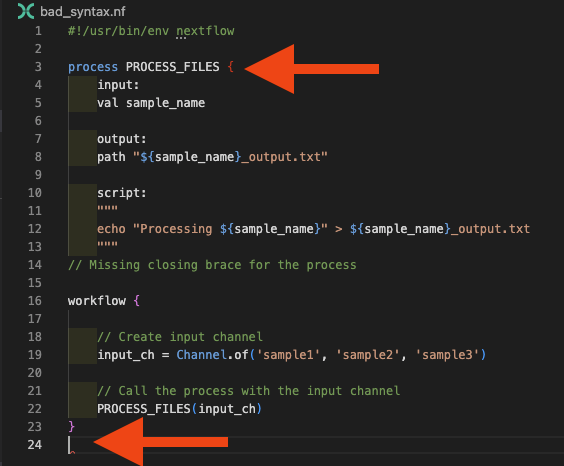
중괄호 오류 디버깅 전략:
- VS Code의 중괄호 매칭 기능 사용 (커서를 중괄호 옆에 놓기)
- 중괄호 관련 메시지를 위해 Problems 패널 확인
- 각 여는
{에 대응하는 닫는}가 있는지 확인
코드 수정
주석을 누락된 닫는 중괄호로 교체합니다:
파이프라인 실행
워크플로우를 다시 실행하여 정상 작동을 확인합니다:
명령 출력
1.2. 잘못된 프로세스 키워드 또는 지시문 사용
또 다른 흔한 구문 오류는 잘못된 프로세스 정의입니다. 필수 블록을 정의하지 않거나 프로세스 정의에서 잘못된 지시문을 사용할 때 발생할 수 있습니다.
파이프라인 실행
명령 출력
N E X T F L O W   ~  version 25.10.2

Launching `invalid_process.nf` [nasty_jepsen] DSL2 - revision: da9758d614

Error invalid_process.nf:3:1: Invalid process definition -- check for missing or out-of-order section labels
│   3 | process PROCESS_FILES {
│     | ^^^^^^^^^^^^^^^^^^^^^^^
│   4 |     inputs:
│   5 |     val sample_name
│   6 |
╰   7 |     output:

ERROR ~ Script compilation failed

 -- Check '.nextflow.log' file for details
코드 확인
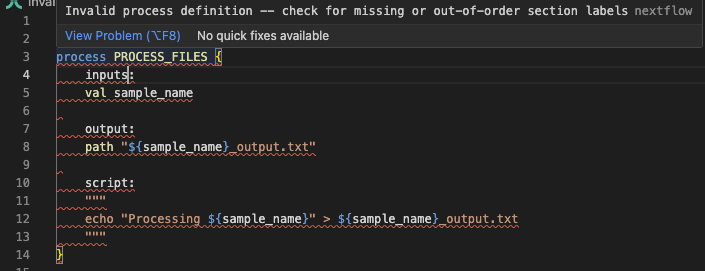
오류 메시지는 "Invalid process definition"을 나타내며 문제 주변의 컨텍스트를 보여줍니다. 3~7번 줄을 보면 4번 줄에 inputs:가 있는 것이 문제입니다. invalid_process.nf를 살펴봅니다:
오류 컨텍스트의 4번 줄을 보면 문제를 발견할 수 있습니다: 올바른 input 지시문 대신 inputs를 사용하고 있습니다. Nextflow VSCode 확장 프로그램도 이를 표시합니다:
코드 수정
문서를 참조하여 잘못된 키워드를 올바른 것으로 교체합니다:
파이프라인 실행
워크플로우를 다시 실행하여 정상 작동을 확인합니다:
명령 출력
1.3. 잘못된 변수 이름 사용
script 블록에서 사용하는 변수 이름은 유효해야 하며, 입력에서 파생되거나 script 앞에 삽입된 Groovy 코드에서 정의되어야 합니다. 하지만 파이프라인 개발 초기에 복잡성을 다루다 보면 변수 이름에서 실수하기 쉽고, Nextflow는 이를 빠르게 알려줍니다.
파이프라인 실행
명령 출력
N E X T F L O W   ~  version 25.10.2

Launching `no_such_var.nf` [gloomy_meninsky] DSL2 - revision: 0c4d3bc28c

Error no_such_var.nf:17:39: `undefined_var` is not defined
│  17 |     echo "Using undefined variable: ${undefined_var}" >> ${output_pref
╰     |                                       ^^^^^^^^^^^^^

ERROR ~ Script compilation failed

 -- Check '.nextflow.log' file for details
오류는 컴파일 시점에 감지되며, 17번 줄의 정의되지 않은 변수를 직접 가리키고 캐럿(^)으로 정확한 위치를 표시합니다.
코드 확인
no_such_var.nf를 살펴봅니다:
오류 메시지는 해당 변수가 script 템플릿에서 인식되지 않음을 나타냅니다. script 블록에서 ${undefined_var}가 사용되고 있지만 다른 곳에서 정의되지 않은 것을 확인할 수 있습니다.
코드 수정
'No such variable' 오류가 발생하면, 변수를 정의하거나(입력 변수 이름을 수정하거나 script 앞의 Groovy 코드를 편집하여), 필요하지 않다면 script 블록에서 제거하여 수정할 수 있습니다:
파이프라인 실행
워크플로우를 다시 실행하여 정상 작동을 확인합니다:
명령 출력
1.4. Bash 변수의 잘못된 사용
Nextflow를 처음 시작할 때, Nextflow(Groovy) 변수와 Bash 변수의 차이를 이해하기 어려울 수 있습니다. 이로 인해 script 블록의 Bash 내용에서 변수를 사용하려 할 때 또 다른 형태의 변수 오류가 발생할 수 있습니다.
파이프라인 실행
명령 출력
N E X T F L O W   ~  version 25.10.2

Launching `bad_bash_var.nf` [infallible_mandelbrot] DSL2 - revision: 0853c11080

Error bad_bash_var.nf:13:42: `prefix` is not defined
│  13 |     echo "Processing ${sample_name}" > ${prefix}.txt
╰     |                                          ^^^^^^

ERROR ~ Script compilation failed

 -- Check '.nextflow.log' file for details
코드 확인
오류는 ${prefix}가 사용된 13번 줄을 가리킵니다. bad_bash_var.nf를 살펴보고 문제의 원인을 확인합니다:
| bad_bash_var.nf | |
|---|---|
이 예제에서는 Bash에서 prefix 변수를 정의하고 있지만, Nextflow 프로세스에서 참조에 사용한 $ 구문(${prefix})은 Bash가 아닌 Groovy 변수로 해석됩니다. 해당 변수가 Groovy 컨텍스트에 존재하지 않으므로 'no such variable' 오류가 발생합니다.
코드 수정
Bash 변수를 사용하려면 달러 기호를 다음과 같이 이스케이프해야 합니다:
이렇게 하면 Nextflow가 이를 Bash 변수로 해석합니다.
파이프라인 실행
워크플로우를 다시 실행하여 정상 작동을 확인합니다:
명령 출력
Groovy 변수 vs Bash 변수
문자열 연결이나 접두사/접미사 작업과 같은 간단한 변수 조작의 경우, script 블록의 Bash 변수보다 script 섹션의 Groovy 변수를 사용하는 것이 일반적으로 더 가독성이 좋습니다:
이 방법은 달러 기호를 이스케이프할 필요가 없으며 코드를 더 읽기 쉽고 유지 관리하기 쉽게 만듭니다.
1.5. workflow 블록 외부의 구문
Nextflow VSCode 확장 프로그램은 오류를 유발하는 코드 구조 문제를 강조 표시합니다. 흔한 예로 workflow {} 블록 외부에 채널을 정의하는 것이 있으며, 이는 현재 구문 오류로 처리됩니다.
파이프라인 실행
명령 출력
N E X T F L O W   ~  version 25.10.2

Launching `badpractice_syntax.nf` [intergalactic_colden] DSL2 - revision: 5e4b291bde

Error badpractice_syntax.nf:3:1: Statements cannot be mixed with script declarations -- move statements into a process or workflow
│   3 | input_ch = channel.of('sample1', 'sample2', 'sample3')
╰     | ^^^^^^^^^^^^^^^^^^^^^^^^^^^^^^^^^^^^^^^^^^^^^^^^^^^^^^

ERROR ~ Script compilation failed

 -- Check '.nextflow.log' file for details
오류 메시지는 문제를 명확하게 나타냅니다: 구문(채널 정의 등)은 workflow 또는 process 블록 외부의 script 선언과 혼합될 수 없습니다.
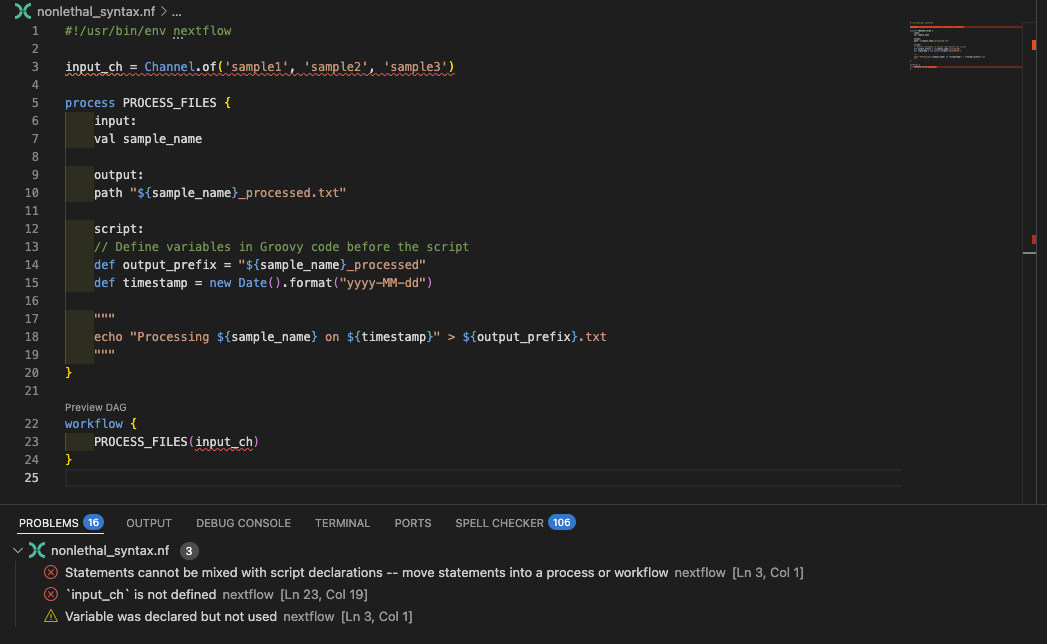
코드 확인
badpractice_syntax.nf를 살펴보고 오류의 원인을 확인합니다:
VSCode 확장 프로그램도 input_ch 변수가 workflow 블록 외부에 정의되어 있음을 강조 표시합니다:
코드 수정
채널 정의를 workflow 블록 안으로 이동합니다:
파이프라인 실행
워크플로우를 다시 실행하여 수정이 작동하는지 확인합니다:
명령 출력
입력 채널은 workflow 블록 안에 정의하고, 일반적으로 확장 프로그램이 제안하는 다른 권장 사항도 따르세요.
핵심 정리
Nextflow 오류 메시지와 IDE 시각적 표시기를 사용하여 구문 오류를 체계적으로 파악하고 수정할 수 있습니다. 흔한 구문 오류로는 중괄호 누락, 잘못된 프로세스 키워드, 정의되지 않은 변수, Bash와 Nextflow 변수의 부적절한 사용 등이 있습니다. VSCode 확장 프로그램은 런타임 전에 이러한 오류를 많이 잡아냅니다. 이러한 구문 디버깅 기술을 갖추면 가장 흔한 Nextflow 구문 오류를 빠르게 해결하고 더 복잡한 런타임 문제를 다룰 수 있습니다.
다음 단계
구문이 올바르더라도 발생하는 더 복잡한 채널 구조 오류를 디버깅하는 방법을 학습합니다.
2. 채널 구조 오류
채널 구조 오류는 구문 오류보다 더 미묘합니다. 코드는 구문적으로 올바르지만, 데이터 형태가 프로세스가 기대하는 것과 일치하지 않기 때문입니다. Nextflow는 파이프라인 실행을 시도하지만, 입력 수가 기대와 다르면 실패할 수 있습니다. 이러한 오류는 일반적으로 런타임에만 나타나며, 워크플로우를 통해 흐르는 데이터에 대한 이해가 필요합니다.
.view()를 사용한 채널 디버깅
이 섹션 전반에 걸쳐, 워크플로우의 어느 지점에서든 .view() 연산자를 사용하여 채널 내용을 검사할 수 있다는 점을 기억하세요. 이는 채널 구조 문제를 이해하는 데 가장 강력한 디버깅 도구 중 하나입니다. 2.4 섹션에서 이 기법을 자세히 살펴보겠지만, 예제를 진행하면서 자유롭게 사용해 보세요.
2.1. 잘못된 입력 채널 수
이 오류는 프로세스가 기대하는 것과 다른 수의 채널을 전달할 때 발생합니다.
파이프라인 실행
명령 출력
N E X T F L O W   ~  version 25.10.2

Launching `bad_number_inputs.nf` [happy_swartz] DSL2 - revision: d83e58dcd3

Error bad_number_inputs.nf:23:5: Incorrect number of call arguments, expected 1 but received 2
│  23 |     PROCESS_FILES(samples_ch, files_ch)
╰     |     ^^^^^^^^^^^^^^^^^^^^^^^^^^^^^^^^^^^

ERROR ~ Script compilation failed

 -- Check '.nextflow.log' file for details
코드 확인
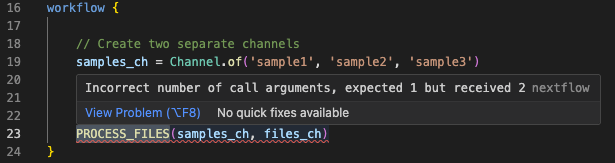
오류 메시지는 호출이 인자 1개를 기대했지만 2개를 받았다고 명확히 나타내며, 23번 줄을 가리킵니다. bad_number_inputs.nf를 살펴봅니다:
프로세스가 하나의 입력 채널만 정의하는데 여러 입력 채널을 제공하는 PROCESS_FILES 호출의 불일치를 확인할 수 있습니다. VSCode 확장 프로그램도 프로세스 호출에 빨간 밑줄을 표시하고, 마우스를 올리면 진단 메시지를 제공합니다:
코드 수정
이 특정 예제에서 프로세스는 단일 채널을 기대하며 두 번째 채널이 필요하지 않으므로, samples_ch 채널만 전달하여 수정할 수 있습니다:
파이프라인 실행
명령 출력
이 예제보다 더 흔한 경우는, 프로세스에 추가 입력을 추가하고 workflow 호출을 그에 맞게 업데이트하는 것을 잊어버리는 것입니다. 다행히 이는 오류 메시지가 불일치를 명확하게 설명하므로 이해하고 수정하기 쉬운 오류 중 하나입니다.
2.2. 채널 소진 (프로세스가 기대보다 적게 실행되는 경우)
일부 채널 구조 오류는 훨씬 더 미묘하며 오류를 전혀 발생시키지 않습니다. 아마도 가장 흔한 경우는 새로운 Nextflow 사용자들이 queue 채널이 소진될 수 있고 항목이 고갈될 수 있다는 것을 이해하는 데 어려움을 겪는 것입니다. 이로 인해 워크플로우가 조기에 종료됩니다.
파이프라인 실행
명령 출력
 N E X T F L O W   ~  version 25.10.2

Launching `exhausted.nf` [extravagant_gauss] DSL2 - revision: 08cff7ba2a

executor >  local (1)
[bd/f61fff] PROCESS_FILES (1) [100%] 1 of 1 ✔
이 워크플로우는 오류 없이 완료되지만, 단 하나의 샘플만 처리합니다!
코드 확인
exhausted.nf를 살펴보고 이것이 맞는지 확인합니다:
reference_ch 채널이 첫 번째 프로세스 실행 후 소진되는 queue 채널이기 때문에 프로세스가 세 번이 아닌 한 번만 실행됩니다. 하나의 채널이 소진되면, 다른 채널에 항목이 남아 있더라도 전체 프로세스가 중단됩니다.
이는 여러 샘플에 걸쳐 재사용해야 하는 단일 레퍼런스 파일이 있는 일반적인 패턴입니다. 해결책은 레퍼런스 채널을 무한히 재사용할 수 있는 value 채널로 변환하는 것입니다.
코드 수정
영향을 받는 파일 수에 따라 몇 가지 방법으로 해결할 수 있습니다.
옵션 1: 많이 재사용하는 단일 레퍼런스 파일이 있는 경우. 반복해서 사용할 수 있는 value 채널 유형을 생성하면 됩니다. 세 가지 방법이 있습니다:
1a channel.value() 사용:
| exhausted.nf (fixed - Option 1a) | |
|---|---|
1b first() 연산자 사용:
| exhausted.nf (fixed - Option 1b) | |
|---|---|
1c. collect() 연산자 사용:
| exhausted.nf (fixed - Option 1c) | |
|---|---|
옵션 2: 샘플 채널의 모든 샘플에 대해 여러 레퍼런스 파일이 있는 더 복잡한 시나리오에서는, combine 연산자를 사용하여 두 채널을 튜플로 결합한 새 채널을 만들 수 있습니다:
| exhausted.nf (fixed - Option 2) | |
|---|---|
.combine() 연산자는 두 채널의 카르테시안 곱을 생성하므로, reference_ch의 각 항목이 input_ch의 각 항목과 쌍을 이룹니다. 이를 통해 레퍼런스를 사용하면서 각 샘플에 대해 프로세스를 실행할 수 있습니다.
이 방법은 프로세스 입력을 조정해야 합니다. 예제에서 프로세스 정의의 시작 부분을 다음과 같이 수정해야 합니다:
| exhausted.nf (fixed - Option 2) | |
|---|---|
이 방법이 모든 상황에 적합하지 않을 수 있습니다.
파이프라인 실행
위의 수정 중 하나를 적용하고 워크플로우를 다시 실행합니다:
명령 출력
이제 하나가 아닌 세 개의 샘플이 모두 처리되는 것을 확인할 수 있습니다.
2.3. 잘못된 채널 내용 구조
워크플로우가 일정 수준의 복잡성에 도달하면, 각 채널의 내부 구조를 추적하기 어려울 수 있습니다. 프로세스가 기대하는 것과 채널이 실제로 포함하는 것 사이에 불일치가 발생하는 경우가 흔합니다. 이는 채널 수가 잘못된 앞서 논의한 문제보다 더 미묘합니다. 이 경우 올바른 수의 입력 채널을 가질 수 있지만, 하나 이상의 채널의 내부 구조가 프로세스가 기대하는 것과 일치하지 않습니다.
파이프라인 실행
명령 출력
Launching `bad_channel_shape.nf` [hopeful_pare] DSL2 - revision: ffd66071a1

executor >  local (3)
executor >  local (3)
[3f/c2dcb3] PROCESS_FILES (3) [  0%] 0 of 3 ✘
ERROR ~ Error executing process > 'PROCESS_FILES (1)'

Caused by:
  Missing output file(s) `[sample1, file1.txt]_output.txt` expected by process `PROCESS_FILES (1)`


Command executed:

  echo "Processing [sample1, file1.txt]" > [sample1, file1.txt]_output.txt

Command exit status:
  0

Command output:
  (empty)

Work dir:
  /workspaces/training/side-quests/debugging/work/d6/1fb69d1d93300bbc9d42f1875b981e

Tip: when you have fixed the problem you can continue the execution adding the option `-resume` to the run command line

-- Check '.nextflow.log' file for details
코드 확인
오류 메시지의 대괄호가 단서를 제공합니다. 프로세스가 튜플을 단일 값으로 처리하고 있는데, 이는 우리가 원하는 것이 아닙니다. bad_channel_shape.nf를 살펴봅니다:
튜플로 구성된 채널 ['sample1', 'file1.txt']을 생성하고 있지만, 프로세스는 단일 값 val sample_name을 기대합니다. 실행된 명령을 보면 프로세스가 [sample3, file3.txt]_output.txt라는 파일을 생성하려 하는데, 이는 의도한 출력이 아닙니다.
코드 수정
프로세스가 두 입력을 모두 필요로 한다면, 프로세스가 튜플을 받도록 조정할 수 있습니다:
파이프라인 실행
해결책 중 하나를 선택하고 워크플로우를 다시 실행합니다:
명령 출력
2.4. 채널 디버깅 기법
채널 검사를 위한 .view() 사용
채널을 위한 가장 강력한 디버깅 도구는 .view() 연산자입니다. .view()를 사용하면 모든 단계에서 채널의 형태를 이해하여 디버깅에 도움을 받을 수 있습니다.
파이프라인 실행
bad_channel_shape_viewed.nf를 실행하여 이를 확인합니다:
명령 출력
N E X T F L O W   ~  version 25.10.2

Launching `bad_channel_shape_viewed.nf` [maniac_poisson] DSL2 - revision: b4f24dc9da

executor >  local (3)
[c0/db76b3] PROCESS_FILES (3) [100%] 3 of 3 ✔
Channel content: [sample1, file1.txt]
Channel content: [sample2, file2.txt]
Channel content: [sample3, file3.txt]
After mapping: sample1
After mapping: sample2
After mapping: sample3
코드 확인
bad_channel_shape_viewed.nf를 살펴보고 .view()가 어떻게 사용되는지 확인합니다:
코드 수정
앞으로 채널 내용을 이해하기 위해 .view() 연산을 과도하게 사용하지 않으려면, 도움이 되는 주석을 추가하는 것이 좋습니다:
| bad_channel_shape_viewed.nf (with comments) | |
|---|---|
워크플로우가 복잡해지고 채널 구조가 불투명해질수록 이것이 더욱 중요해집니다.
파이프라인 실행
명령 출력
N E X T F L O W   ~  version 25.10.2

Launching `bad_channel_shape_viewed.nf` [marvelous_koch] DSL2 - revision: 03e79cdbad

executor >  local (3)
[ff/d67cec] PROCESS_FILES (2) | 3 of 3 ✔
Channel content: [sample1, file1.txt]
Channel content: [sample2, file2.txt]
Channel content: [sample3, file3.txt]
After mapping: sample1
After mapping: sample2
After mapping: sample3
핵심 정리
유효한 Nextflow 구문으로도 많은 채널 구조 오류가 발생할 수 있습니다. 데이터 흐름을 이해하고, 검사를 위해 .view() 연산자를 사용하고, 예상치 못한 튜플 구조를 나타내는 대괄호와 같은 오류 메시지 패턴을 인식하여 채널 구조 오류를 디버깅할 수 있습니다.
다음 단계
프로세스 정의로 인해 발생하는 오류에 대해 학습합니다.
3. 프로세스 구조 오류
프로세스와 관련하여 발생하는 대부분의 오류는 명령 구성 실수나 기반 소프트웨어 관련 문제에서 비롯됩니다. 그렇지만 위의 채널 문제와 유사하게, 구문 오류에 해당하지는 않지만 런타임에 오류를 유발하는 프로세스 정의 실수를 할 수 있습니다.
3.1. 출력 파일 누락
프로세스를 작성할 때 흔한 오류 중 하나는 프로세스가 기대하는 것과 실제로 생성되는 것 사이에 불일치를 만드는 것입니다.
파이프라인 실행
명령 출력
N E X T F L O W   ~  version 25.10.2

Launching `missing_output.nf` [zen_stone] DSL2 - revision: 37ff61f926

executor >  local (3)
executor >  local (3)
[fd/2642e9] process > PROCESS_FILES (2) [ 66%] 2 of 3, failed: 2
ERROR ~ Error executing process > 'PROCESS_FILES (3)'

Caused by:
  Missing output file(s) `sample3.txt` expected by process `PROCESS_FILES (3)`


Command executed:

  echo "Processing sample3" > sample3_output.txt

Command exit status:
  0

Command output:
  (empty)

Work dir:
  /workspaces/training/side-quests/debugging/work/02/9604d49fb8200a74d737c72a6c98ed

Tip: when you have fixed the problem you can continue the execution adding the option `-resume` to the run command line

-- Check '.nextflow.log' file for details
코드 확인
오류 메시지는 프로세스가 sample3.txt라는 출력 파일을 생성할 것으로 기대했지만, 스크립트가 실제로 sample3_output.txt를 생성한다고 나타냅니다. missing_output.nf의 프로세스 정의를 살펴봅니다:
| missing_output.nf | |
|---|---|
output: 블록의 출력 파일 이름과 스크립트에서 사용된 이름 사이에 불일치가 있음을 확인할 수 있습니다. 이 불일치로 인해 프로세스가 실패합니다. 이런 종류의 오류가 발생하면, 프로세스 정의와 출력 블록 사이에 출력이 일치하는지 다시 확인하세요.
문제가 여전히 명확하지 않다면, work 디렉토리 자체를 확인하여 실제로 생성된 출력 파일을 파악하세요:
이 예제에서는 output: 정의와 달리 출력 파일 이름에 _output 접미사가 포함되어 있음을 확인할 수 있습니다.
코드 수정
출력 파일 이름을 일관되게 만들어 불일치를 수정합니다:
파이프라인 실행
명령 출력
3.2. 소프트웨어 누락
또 다른 종류의 오류는 소프트웨어 프로비저닝 실수로 인해 발생합니다. missing_software.nf는 구문적으로 유효한 워크플로우이지만, 사용하는 cowpy 명령을 제공하는 외부 소프트웨어에 의존합니다.
파이프라인 실행
명령 출력
ERROR ~ Error executing process > 'PROCESS_FILES (3)'

Caused by:
  Process `PROCESS_FILES (3)` terminated with an error exit status (127)


Command executed:

  cowpy sample3 > sample3_output.txt

Command exit status:
  127

Command output:
  (empty)

Command error:
  .command.sh: line 2: cowpy: command not found

Work dir:
  /workspaces/training/side-quests/debugging/work/82/42a5bfb60c9c6ee63ebdbc2d51aa6e

Tip: you can try to figure out what's wrong by changing to the process work directory and showing the script file named `.command.sh`

-- Check '.nextflow.log' file for details
프로세스가 지정한 명령에 접근할 수 없습니다. 때로는 워크플로우 bin 디렉토리에 스크립트가 있지만 실행 가능하게 설정되지 않은 경우이고, 다른 경우에는 워크플로우가 실행되는 컨테이너나 환경에 소프트웨어가 설치되지 않은 경우입니다.
코드 확인
127 종료 코드를 주목하세요. 정확히 문제를 알려줍니다. missing_software.nf를 살펴봅니다:
| missing_software.nf | |
|---|---|
코드 수정
여기서는 약간 불공평하게 설명했습니다. 실제로 코드에는 아무 문제가 없습니다. 해당 명령에 접근할 수 있는 방식으로 프로세스를 실행하는 데 필요한 설정을 지정하기만 하면 됩니다. 이 경우 프로세스에 컨테이너 정의가 있으므로, Docker를 활성화하여 워크플로우를 실행하기만 하면 됩니다.
파이프라인 실행
nextflow.config에 Docker 프로파일을 설정해 두었으므로, 다음과 같이 워크플로우를 실행할 수 있습니다:
명령 출력
참고
Nextflow가 컨테이너를 사용하는 방법에 대해 자세히 알아보려면 Hello Nextflow를 참조하세요.
3.3. 잘못된 리소스 설정
프로덕션 환경에서는 프로세스에 리소스를 설정합니다. 예를 들어 memory는 프로세스에 사용 가능한 최대 메모리 양을 정의하며, 프로세스가 이를 초과하면 스케줄러가 일반적으로 프로세스를 종료하고 종료 코드 137을 반환합니다. local executor를 사용하고 있어 여기서 직접 시연할 수는 없지만, time으로 유사한 상황을 보여줄 수 있습니다.
파이프라인 실행
bad_resources.nf는 1밀리초라는 비현실적인 시간 제한이 있는 프로세스 설정을 가지고 있습니다:
명령 출력
N E X T F L O W   ~  version 25.10.2

Launching `bad_resources.nf` [disturbed_elion] DSL2 - revision: 27d2066e86

executor >  local (3)
[c0/ded8e1] PROCESS_FILES (3) | 0 of 3 ✘
ERROR ~ Error executing process > 'PROCESS_FILES (2)'

Caused by:
  Process exceeded running time limit (1ms)

Command executed:

  cowpy sample2 > sample2_output.txt

Command exit status:
  -

Command output:
  (empty)

Work dir:
  /workspaces/training/side-quests/debugging/work/53/f0a4cc56d6b3dc2a6754ff326f1349

Container:
  community.wave.seqera.io/library/cowpy:1.1.5--3db457ae1977a273

Tip: you can replicate the issue by changing to the process work dir and entering the command `bash .command.run`

 -- Check '.nextflow.log' file for details
코드 확인
bad_resources.nf를 살펴봅니다:
| bad_resources.nf | |
|---|---|
프로세스가 1초 이상 걸릴 것을 알고 있지만(확실히 하기 위해 sleep을 추가했습니다), 프로세스는 1밀리초 후에 타임아웃되도록 설정되어 있습니다. 설정이 다소 비현실적입니다!
코드 수정
시간 제한을 현실적인 값으로 늘립니다:
파이프라인 실행
명령 출력
오류 메시지를 꼼꼼히 읽는다면 이런 실패로 오래 고민하지 않을 것입니다. 하지만 실행하는 명령의 리소스 요구 사항을 이해하여 리소스 지시문을 적절히 설정할 수 있도록 하세요.
3.4. 프로세스 디버깅 기법
프로세스가 실패하거나 예상치 못한 동작을 보일 때, 무엇이 잘못되었는지 조사하기 위한 체계적인 기법이 필요합니다. work 디렉토리에는 프로세스 실행을 디버깅하는 데 필요한 모든 정보가 포함되어 있습니다.
Work 디렉토리 검사 사용
프로세스를 위한 가장 강력한 디버깅 도구는 work 디렉토리를 검사하는 것입니다. 프로세스가 실패하면, Nextflow는 해당 특정 프로세스 실행을 위한 work 디렉토리를 생성하며, 여기에는 무슨 일이 일어났는지 이해하는 데 필요한 모든 파일이 포함됩니다.
파이프라인 실행
앞서 살펴본 missing_output.nf 예제를 사용하여 work 디렉토리 검사를 시연합니다(필요하다면 출력 이름 불일치를 다시 생성하세요):
명령 출력
N E X T F L O W   ~  version 25.10.2

Launching `missing_output.nf` [irreverent_payne] DSL2 - revision: 3d5117f7e2

executor >  local (3)
[5d/d544a4] PROCESS_FILES (2) | 0 of 3 ✘
ERROR ~ Error executing process > 'PROCESS_FILES (1)'

Caused by:
  Missing output file(s) `sample1.txt` expected by process `PROCESS_FILES (1)`

Command executed:

  echo "Processing sample1" > sample1_output.txt

Command exit status:
  0

Command output:
  (empty)

Work dir:
  /workspaces/training/side-quests/debugging/work/1e/2011154d0b0f001cd383d7364b5244

Tip: you can replicate the issue by changing to the process work dir and entering the command `bash .command.run`

 -- Check '.nextflow.log' file for details
Work 디렉토리 확인
이 오류가 발생하면, work 디렉토리에 모든 디버깅 정보가 포함되어 있습니다. 오류 메시지에서 work 디렉토리 경로를 찾아 내용을 확인합니다:
그런 다음 주요 파일을 검사할 수 있습니다:
명령 스크립트 확인
.command.sh 파일은 실행된 정확한 명령을 보여줍니다:
이를 통해 다음을 확인할 수 있습니다:
- 변수 치환: Nextflow 변수가 올바르게 확장되었는지
- 파일 경로: 입력 파일이 올바르게 위치했는지
- 명령 구조: 스크립트 구문이 올바른지
확인해야 할 일반적인 문제:
- 따옴표 누락: 공백이 포함된 변수는 적절한 따옴표가 필요합니다
- 잘못된 파일 경로: 존재하지 않거나 잘못된 위치에 있는 입력 파일
- 잘못된 변수 이름: 변수 참조의 오타
- 환경 설정 누락: 특정 환경에 의존하는 명령
오류 출력 확인
.command.err 파일에는 실제 오류 메시지가 포함되어 있습니다:
이 파일에는 다음이 표시됩니다:
- 종료 코드: 127 (명령을 찾을 수 없음), 137 (종료됨) 등
- 권한 오류: 파일 접근 문제
- 소프트웨어 오류: 애플리케이션별 오류 메시지
- 리소스 오류: 메모리/시간 제한 초과
표준 출력 확인
.command.out 파일은 명령이 생성한 내용을 보여줍니다:
이를 통해 다음을 확인할 수 있습니다:
- 기대 출력: 명령이 올바른 결과를 생성했는지
- 부분 실행: 명령이 시작되었지만 중간에 실패했는지
- 디버그 정보: 스크립트의 진단 출력
종료 코드 확인
.exitcode 파일에는 프로세스의 종료 코드가 포함되어 있습니다:
일반적인 종료 코드와 의미:
- 종료 코드 127: 명령을 찾을 수 없음 - 소프트웨어 설치 확인
- 종료 코드 137: 프로세스 종료됨 - 메모리/시간 제한 확인
파일 존재 확인
출력 파일 누락으로 프로세스가 실패할 때, 실제로 생성된 파일을 확인합니다:
이를 통해 다음을 파악할 수 있습니다:
- 파일 이름 불일치: 기대와 다른 이름의 출력 파일
- 권한 문제: 생성할 수 없는 파일
- 경로 문제: 잘못된 디렉토리에 생성된 파일
앞서 예제에서 이를 통해 기대한 sample3.txt는 없지만 sample3_output.txt가 있음을 확인했습니다:
핵심 정리
프로세스 디버깅은 무엇이 잘못되었는지 이해하기 위해 work 디렉토리를 검사해야 합니다. 주요 파일로는 .command.sh(실행된 스크립트), .command.err(오류 메시지), .command.out(표준 출력)이 있습니다. 127(명령을 찾을 수 없음)과 137(프로세스 종료됨) 같은 종료 코드는 실패 유형에 대한 즉각적인 진단 단서를 제공합니다.
다음 단계
Nextflow의 내장 디버깅 도구와 체계적인 문제 해결 방법에 대해 학습합니다.
4. 내장 디버깅 도구 및 고급 기법
Nextflow는 워크플로우 실행을 디버깅하고 분석하기 위한 여러 강력한 내장 도구를 제공합니다. 이러한 도구는 무엇이 잘못되었는지, 어디서 잘못되었는지, 그리고 효율적으로 수정하는 방법을 이해하는 데 도움을 줍니다.
4.1. 실시간 프로세스 출력
때로는 실행 중인 프로세스 내부에서 무슨 일이 일어나는지 확인해야 합니다. 실시간 프로세스 출력을 활성화하면 각 작업이 실행되는 동안 정확히 무엇을 하는지 볼 수 있습니다.
파이프라인 실행
앞서 예제의 bad_channel_shape_viewed.nf는 .view()를 사용하여 채널 내용을 출력했지만, debug 지시문을 사용하여 프로세스 내부에서 변수를 에코할 수도 있습니다. 이를 bad_channel_shape_viewed_debug.nf에서 시연합니다. 워크플로우를 실행합니다:
명령 출력
N E X T F L O W   ~  version 25.10.2

Launching `bad_channel_shape_viewed_debug.nf` [agitated_crick] DSL2 - revision: ea3676d9ec

executor >  local (3)
[c6/2dac51] process > PROCESS_FILES (3) [100%] 3 of 3 ✔
Channel content: [sample1, file1.txt]
Channel content: [sample2, file2.txt]
Channel content: [sample3, file3.txt]
After mapping: sample1
After mapping: sample2
After mapping: sample3
Sample name inside process is sample2

Sample name inside process is sample1

Sample name inside process is sample3
코드 확인
bad_channel_shape_viewed_debug.nf를 살펴보고 debug 지시문이 어떻게 작동하는지 확인합니다:
| bad_channel_shape_viewed_debug.nf | |
|---|---|
debug 지시문은 프로세스의 환경을 이해하는 빠르고 편리한 방법이 될 수 있습니다.
4.2. Preview 모드
때로는 프로세스가 실행되기 전에 문제를 잡고 싶을 수 있습니다. Nextflow는 이런 종류의 사전 디버깅을 위한 플래그를 제공합니다: -preview.
파이프라인 실행
Preview 모드를 사용하면 명령을 실행하지 않고 워크플로우 로직을 테스트할 수 있습니다. 실제 명령을 실행하지 않고도 워크플로우 구조를 빠르게 확인하고 프로세스가 올바르게 연결되어 있는지 확인하는 데 매우 유용합니다.
참고
앞서 bad_syntax.nf를 수정했다면, 이 명령을 실행하기 전에 script 블록 뒤의 닫는 중괄호를 제거하여 구문 오류를 다시 도입하세요.
다음 명령을 실행합니다:
명령 출력
Preview 모드는 프로세스를 실행하지 않고 구문 오류를 조기에 잡는 데 특히 유용합니다. 실행 전에 워크플로우 구조와 프로세스 연결을 검증합니다.
4.3. 로직 테스트를 위한 Stub 실행
때로는 명령이 너무 오래 걸리거나, 특수 소프트웨어가 필요하거나, 복잡한 이유로 실패하기 때문에 오류를 디버깅하기 어렵습니다. Stub 실행을 사용하면 실제 명령을 실행하지 않고 워크플로우 로직을 테스트할 수 있습니다.
파이프라인 실행
Nextflow 프로세스를 개발할 때, stub 지시문을 사용하여 실제 명령 대신 올바른 형태의 출력을 생성하는 '더미' 명령을 정의할 수 있습니다. 이 방법은 실제 소프트웨어의 복잡성을 다루기 전에 워크플로우 로직이 올바른지 확인하고 싶을 때 특히 유용합니다.
예를 들어, 앞서 살펴본 missing_software.nf를 기억하시나요? -profile docker를 추가하기 전까지 워크플로우 실행을 막았던 소프트웨어 누락 문제가 있었던 것 말이죠? missing_software_with_stub.nf는 매우 유사한 워크플로우입니다. 같은 방식으로 실행하면 동일한 오류가 발생합니다:
명령 출력
ERROR ~ Error executing process > 'PROCESS_FILES (3)'

Caused by:
  Process `PROCESS_FILES (3)` terminated with an error exit status (127)


Command executed:

  cowpy sample3 > sample3_output.txt

Command exit status:
  127

Command output:
  (empty)

Command error:
  .command.sh: line 2: cowpy: command not found

Work dir:
  /workspaces/training/side-quests/debugging/work/82/42a5bfb60c9c6ee63ebdbc2d51aa6e

Tip: you can try to figure out what's wrong by changing to the process work directory and showing the script file named `.command.sh`

-- Check '.nextflow.log' file for details
하지만 이 워크플로우는 docker 프로파일 없이도 -stub-run으로 실행하면 오류가 발생하지 않습니다:
명령 출력
코드 확인
missing_software_with_stub.nf를 살펴봅니다:
| missing_software.nf (with stub) | |
|---|---|
missing_software.nf와 비교하면, 이 프로세스에는 Nextflow가 stub 모드로 실행될 때 script:에 지정된 명령 대신 사용할 명령을 지정하는 stub: 지시문이 있습니다.
여기서 사용하는 touch 명령은 어떤 소프트웨어나 적절한 입력에도 의존하지 않으며, 모든 상황에서 실행되어 프로세스 내부를 걱정하지 않고 워크플로우 로직을 디버깅할 수 있게 합니다.
Stub 실행이 디버깅에 도움이 되는 경우:
- 채널 구조 및 데이터 흐름
- 프로세스 연결 및 의존성
- 매개변수 전파
- 소프트웨어 의존성 없이 워크플로우 로직
4.4. 체계적인 디버깅 접근법
trace 파일과 work 디렉토리부터 preview 모드, stub 실행, 리소스 모니터링까지 개별 디버깅 기법을 배웠으니, 이제 이를 체계적인 방법론으로 통합해 보겠습니다. 구조화된 접근법을 갖추면 복잡한 오류에 압도되지 않고 중요한 단서를 놓치지 않을 수 있습니다.
이 방법론은 우리가 다룬 모든 도구를 효율적인 워크플로우로 결합합니다:
4단계 디버깅 방법:
1단계: 구문 오류 해결 (5분)
- VSCode 또는 IDE에서 빨간 밑줄 확인
nextflow run workflow.nf -preview를 실행하여 구문 문제 파악- 모든 구문 오류 수정 (중괄호 누락, 후행 쉼표 등)
- 진행하기 전에 워크플로우가 성공적으로 파싱되는지 확인
2단계: 빠른 평가 (5분)
- 런타임 오류 메시지를 주의 깊게 읽기
- 런타임, 로직, 또는 리소스 오류인지 확인
- Preview 모드를 사용하여 기본 워크플로우 로직 테스트
3단계: 상세 조사 (15~30분)
- 실패한 작업의 work 디렉토리 찾기
- 로그 파일 검사
- 채널 검사를 위해
.view()연산자 추가 -stub-run을 사용하여 실행 없이 워크플로우 로직 테스트
4단계: 수정 및 검증 (15분)
- 최소한의 목표 수정 적용
- resume으로 테스트:
nextflow run workflow.nf -resume - 완전한 워크플로우 실행 확인
효율적인 디버깅을 위한 Resume 사용
문제를 파악한 후에는 워크플로우의 성공적인 부분을 다시 실행하는 데 시간을 낭비하지 않고 수정 사항을 효율적으로 테스트하는 방법이 필요합니다. Nextflow의 -resume 기능은 디버깅에 매우 유용합니다.
Hello Nextflow를 진행했다면 -resume을 접했을 것입니다. 문제 프로세스 이전의 프로세스가 실행되는 동안 기다리지 않으려면 디버깅 시 이를 잘 활용하는 것이 중요합니다.
Resume 디버깅 전략:
- 실패할 때까지 워크플로우 실행
- 실패한 작업의 work 디렉토리 검사
- 특정 문제 수정
- 수정 사항만 테스트하기 위해 resume
- 워크플로우가 완료될 때까지 반복
디버깅 설정 프로파일
이 체계적인 접근법을 더욱 효율적으로 만들기 위해, 필요한 모든 도구를 자동으로 활성화하는 전용 디버깅 설정을 만들 수 있습니다:
| nextflow.config (debug profile) | |
|---|---|
그런 다음 이 프로파일을 활성화하여 파이프라인을 실행할 수 있습니다:
이 프로파일은 실시간 출력을 활성화하고, work 디렉토리를 보존하며, 더 쉬운 디버깅을 위해 병렬 처리를 제한합니다.
4.5. 실전 디버깅 연습
이제 체계적인 디버깅 접근법을 실제로 적용할 시간입니다. buggy_workflow.nf 워크플로우에는 실제 개발에서 마주치는 유형의 문제를 나타내는 여러 일반적인 오류가 포함되어 있습니다.
연습
체계적인 디버깅 접근법을 사용하여 buggy_workflow.nf의 모든 오류를 파악하고 수정하세요. 이 워크플로우는 CSV 파일에서 샘플 데이터를 처리하려 하지만, 일반적인 디버깅 시나리오를 나타내는 여러 의도적인 버그가 포함되어 있습니다.
워크플로우를 실행하여 첫 번째 오류를 확인합니다:
명령 출력
N E X T F L O W   ~  version 25.10.2

Launching `buggy_workflow.nf` [wise_ramanujan] DSL2 - revision: d51a8e83fd

ERROR ~ Range [11, 12) out of bounds for length 11

 -- Check '.nextflow.log' file for details
이 불명확한 오류는 params{} 블록의 11~12번 줄 근처에서 파싱 문제가 있음을 나타냅니다. v2 파서는 구조적 문제를 조기에 감지합니다.
배운 4단계 디버깅 방법을 적용합니다:
1단계: 구문 오류 해결
- VSCode 또는 IDE에서 빨간 밑줄 확인
- nextflow run workflow.nf -preview를 실행하여 구문 문제 파악
- 모든 구문 오류 수정 (중괄호 누락, 후행 쉼표 등)
- 진행하기 전에 워크플로우가 성공적으로 파싱되는지 확인
2단계: 빠른 평가
- 런타임 오류 메시지를 주의 깊게 읽기
- 오류가 런타임, 로직, 또는 리소스 관련인지 파악
- -preview 모드를 사용하여 기본 워크플로우 로직 테스트
3단계: 상세 조사
- 실패한 작업의 work 디렉토리 검사
- 채널 검사를 위해 .view() 연산자 추가
- work 디렉토리의 로그 파일 확인
- -stub-run을 사용하여 실행 없이 워크플로우 로직 테스트
4단계: 수정 및 검증
- 목표 수정 적용
- -resume을 사용하여 효율적으로 수정 사항 테스트
- 완전한 워크플로우 실행 확인
사용 가능한 디버깅 도구:
# 구문 확인을 위한 preview 모드
nextflow run buggy_workflow.nf -preview

# 상세 출력을 위한 debug 프로파일
nextflow run buggy_workflow.nf -profile debug

# 로직 테스트를 위한 stub 실행
nextflow run buggy_workflow.nf -stub-run

# 수정 후 resume
nextflow run buggy_workflow.nf -resume
해결책
buggy_workflow.nf에는 모든 주요 디버깅 카테고리를 다루는 9~10개의 별개 오류가 포함되어 있습니다(세는 방법에 따라 다름). 각 오류와 수정 방법에 대한 체계적인 분석입니다.
먼저 구문 오류부터 시작합니다:
오류 1: 구문 오류 - 후행 쉼표
수정: 후행 쉼표 제거오류 2: 구문 오류 - 닫는 중괄호 누락
오류 3: 변수 이름 오류
오류 4: 정의되지 않은 변수 오류
이 시점에서 워크플로우가 실행되지만, processFiles에서 Path value cannot be null과 같은 오류가 발생합니다. 이는 잘못된 채널 구조로 인한 것입니다.
오류 5: 채널 구조 오류 - 잘못된 map 출력
하지만 이렇게 하면 위의 heavyProcess() 실행이 중단되므로, map을 사용하여 해당 프로세스에 샘플 ID만 전달해야 합니다:
오류 6: heavyProcess의 잘못된 채널 구조
이제 더 진행되지만 No such variable: i 오류가 발생합니다. Bash 변수를 이스케이프하지 않았기 때문입니다.
오류 7: Bash 변수 이스케이프 오류
이제 Process exceeded running time limit (1ms) 오류가 발생하므로, 관련 프로세스의 실행 시간 제한을 수정합니다:
오류 8: 리소스 설정 오류
다음으로 Missing output file(s) 오류를 해결합니다:
오류 9: 출력 파일 이름 불일치
처음 두 프로세스는 실행되었지만 세 번째는 실행되지 않았습니다.
오류 10: 출력 파일 이름 불일치
수정: 이전 프로세스의 출력 사용이제 전체 워크플로우가 실행됩니다.
완전히 수정된 워크플로우:
다루는 오류 카테고리:
- 구문 오류: 중괄호 누락, 후행 쉼표, 정의되지 않은 변수
- 채널 구조 오류: 잘못된 데이터 형태, 정의되지 않은 채널
- 프로세스 오류: 출력 파일 불일치, 변수 이스케이프
- 리소스 오류: 비현실적인 시간 제한
핵심 디버깅 교훈:
- 오류 메시지를 주의 깊게 읽기 - 종종 문제를 직접 가리킵니다
- 체계적인 접근법 사용 - 한 번에 하나의 오류를 수정하고
-resume으로 테스트 - 데이터 흐름 이해 - 채널 구조 오류가 종종 가장 미묘합니다
- work 디렉토리 확인 - 프로세스가 실패하면 로그가 정확히 무엇이 잘못되었는지 알려줍니다
요약
이 사이드 퀘스트에서 Nextflow 워크플로우를 디버깅하기 위한 체계적인 기법들을 학습했습니다. 이러한 기법들을 실제 작업에 적용하면 컴퓨터와 씨름하는 시간을 줄이고, 문제를 더 빠르게 해결하며, 미래의 문제로부터 자신을 보호할 수 있습니다.
핵심 패턴
1. 구문 오류를 파악하고 수정하는 방법:
- Nextflow 오류 메시지 해석 및 문제 위치 파악
- 일반적인 구문 오류: 중괄호 누락, 잘못된 키워드, 정의되지 않은 변수
- Nextflow(Groovy) 변수와 Bash 변수 구분
- 조기 오류 감지를 위한 VS Code 확장 프로그램 기능 활용
// 중괄호 누락 - IDE에서 빨간 밑줄 확인
process FOO {
    script:
    """
    echo "hello"
    """
// } <-- 누락!

// 잘못된 키워드
inputs:  // 'input:'이어야 함

// 정의되지 않은 변수 - Bash 변수는 백슬래시로 이스케이프
echo "${undefined_var}"      // Nextflow 변수 (정의되지 않으면 오류)
echo "\${bash_var}"          // Bash 변수 (이스케이프됨)
2. 채널 구조 문제를 디버깅하는 방법:
- 채널 카디널리티 및 소진 문제 이해
- 채널 내용 구조 불일치 디버깅
- 채널 검사를 위한
.view()연산자 사용 - 출력의 대괄호와 같은 오류 패턴 인식
// 채널 내용 검사
my_channel.view { "Content: $it" }

// queue 채널을 value 채널로 변환 (소진 방지)
reference_ch = channel.value('ref.fa')
// 또는
reference_ch = channel.of('ref.fa').first()
3. 프로세스 실행 문제를 해결하는 방법:
- 출력 파일 누락 오류 진단
- 종료 코드 이해 (소프트웨어 누락의 경우 127, 메모리 문제의 경우 137)
- work 디렉토리 및 명령 파일 조사
- 리소스를 적절히 설정
# 실제로 실행된 내용 확인
cat work/ab/cdef12/.command.sh

# 오류 출력 확인
cat work/ab/cdef12/.command.err

# 종료 코드 127 = 명령을 찾을 수 없음
# 종료 코드 137 = 종료됨 (메모리/시간 제한)
4. Nextflow의 내장 디버깅 도구를 사용하는 방법:
- Preview 모드 및 실시간 디버깅 활용
- 로직 테스트를 위한 stub 실행 구현
- 효율적인 디버깅 사이클을 위한 resume 적용
- 4단계 체계적인 디버깅 방법론 따르기
빠른 디버깅 참조
구문 오류? → VSCode 경고 확인, nextflow run workflow.nf -preview 실행
채널 문제? → .view()를 사용하여 내용 검사: my_channel.view()
프로세스 실패? → work 디렉토리 파일 확인:
.command.sh- 실행된 스크립트.command.err- 오류 메시지.exitcode- 종료 상태 (127 = 명령을 찾을 수 없음, 137 = 종료됨)
원인 불명의 동작? → -stub-run으로 워크플로우 로직 테스트
수정 완료? → -resume을 사용하여 시간 절약: nextflow run workflow.nf -resume
추가 자료
- Nextflow 문제 해결 가이드: 공식 문제 해결 문서
- Nextflow 채널 이해하기: 채널 유형과 동작에 대한 심층 분석
- 프로세스 지시문 참조: 사용 가능한 모든 프로세스 설정 옵션
- nf-test: Nextflow 파이프라인을 위한 테스트 프레임워크
- Nextflow Slack 커뮤니티: 커뮤니티에서 도움 받기
프로덕션 워크플로우의 경우 다음을 고려하세요:
- 대규모 모니터링 및 디버깅을 위한 Seqera Platform 설정
- 재현 가능한 소프트웨어 환경을 위한 Wave 컨테이너 사용
기억하세요: 효과적인 디버깅은 연습을 통해 향상되는 기술입니다. 여기서 습득한 체계적인 방법론과 포괄적인 도구들은 Nextflow 개발 여정 전반에 걸쳐 큰 도움이 될 것입니다.
다음 단계
사이드 퀘스트 메뉴로 돌아가거나, 페이지 오른쪽 하단의 버튼을 클릭하여 목록의 다음 주제로 이동하세요.